| |
|
|
| |
| |
Live Cell Imaging and Characterization of GPCR-Ligand Interactions
|
|
|
|
| |
|
|
|
| |
Live Cell Imaging and Characterization of GPCR-Ligand Interactions
G-protein-coupled receptors (GPCRs) are prominent pharmaceutical targets, with over 40% of drug discovery programs currently focused exclusively on this receptor superfamily (Eglen et al., 2007). Although assays targeted at downstream GPCR signaling events have allowed characterization of GPCRs, few non-destructive assays enable analysis of the receptor-ligand interaction at the cellular level. The emergence of cell-based screening and high content analysis platforms have offered improved approaches for detecting and quantifying GPCR responses in living cells. The development of high throughput confocal imagers, which combine high-resolution fluorescence microscopy with automated image analysis, together with availability of high quality cell lines, have provided a sensitive platform for monitoring ligand-induced cell changes in living cells in a quantitative manner.
PerkinElmer offers over 280 fully validated ValiScreen® GPCR recombinant cell lines, 64 validated AequoZen® and cAMPZen® frozen cells, and advanced cell-based screening and analysis technologies for understanding complex disease mechanisms, which will allow the development of the next generation of drugs. The Opera® high content screening (HCS) system, combines a precise confocal microplate imaging reader with the highly powerful Acapella™ imaging and analysis software. Cells can be imaged in real time for a direct measurement of ligand binding affinity at the single cell level. This powerful screening tool enables simultaneous high speed image acquisition and high resolution screening at the cellular and sub-cellular levels.
Characterizing receptor-ligand interaction in live cells
The Opera HCS system was used to analyze GPCR-ligand interactions in stable recombinant cell lines expressing specific GPCRs. ValiScreen CHO cells expressing the human adenosine A1, dopamine D1, histamine H2, or muscarinic M3 receptors (catalog number ES-010-C, ES-172-C, ES-391-C, or ES-212-C, respectively, PerkinElmer), and HEK cells expressing the human ß2-adrenoceptor (PerkinElmer CT, Germany) were tested. High affinity fluorescent GPCR ligands (CellAura Technologies Ltd.), which have been functionally validated to selectively target GPCRs, were used. These fluorescent GPCR ligands are well-characterized drug-like molecules linked to standard fluorophore dyes. Table 1 summarizes the various GPCR receptors tested, as well as the corresponding fluorescent ligands and unlabelled antagonists from CellAura.
Table 1. GPCR Receptors Analyzed
| Receptor |
CellAura Ligand |
Antagonist |
Adenosine A1 |
CA200634 |
XAC |
Dopamine D1 |
CA200766 |
SCH 23390 |
Histamine H2 |
CA200821 |
Ranitidine |
Muscarinic M3 |
CA200887 |
4-DAMP |
β2-Adrenoceptor |
CA200656 |
ICI 118551 |
List of all GPCR receptors analyzed in this study, including the corresponding fluorescent ligands and unlabelled antagonists. The high affinity fluorescent ligands for GPCR have comparable pharmacological properties to the parent ligand.
Semi-confluent CHO or HEK cells stably expressing specific receptors were pre-incubated with unlabelled ligand antagonists for 30 minutes at room temperature prior to the addition of receptor selective fluorescent ligands. Following the addition of fluorescent ligand, membrane binding was detected over a 20-minute period on the Opera system. Nuclei were counter-stained with HOECHST nuclear stain and excited using the 405 nm laser, and the fluorescence was collected through 450/50 bandpass filter. The fluorescent ligands were excited by the 635 nm laser and the fluorescence was collected through 690/50 bandpass filter. Binding of the fluorescent ligand to CHO or HEK cells expressing a specific receptor was displaced by pre-incubation with the unlabelled competitor (Figure 1).
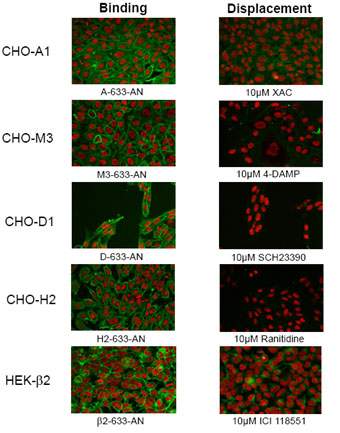
Figure 1. Specific membrane binding of various fluorescent ligands was detected in live cells imaged on the PerkinElmer Opera™ confocal microplate imaging reader. Left panels: Fluorescent ligands (30 nM) binding to CHO or HEK cells stably expressing the specific receptor. Right panels: Selective membrane binding of the fluorescent ligand blocked by a 30 minute pre-incubation with an unlabelled competitor (10 μM). Nuclei were counter-stained with HOECHST nuclear stain.
Localization and quantification of fluorescence
The Opera HCS platform is provided with Acapella, a comprehensive and fully flexible image analysis software with an open software architecture for user-defined applications. Acapella allows precise quantification of the location, shape, structure, and amount of fluorescence at the individual cell level. Due to its high speed, Acapella software is ideally suited for analysis of large data sets. A set of ready-made application solutions, or “scripts”, is available for a broad range of standard situations like counting, translocation, spot analysis, etc. The software’s Region Selection Tools make it easy to define cellular regions using intuitive commands (Figure 2A-D).
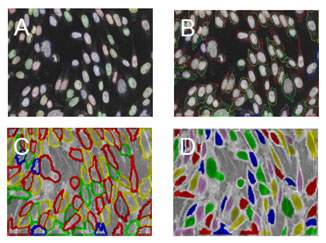
Figure 2. Analysis of membrane-bound and cytoplasmic fluorescence using the Acapella™ imaging software. The nucleus (A) and cytoplasm (B) are identified by defined algorithms. Once the cell membrane (C) and cytoplasm (D) have been identified, the degree of fluorescence in these areas can be determined.
Acapella was used to analyze the location and levels of fluorescence in the cell membrane and cytoplasm of CHO cells stably expressing histamine H2 receptors. Cells were treated with varying concentrations of the H2-633-AN fluorescent ligand in the presence of increasing concentrations of the unlabelled competitor, ranitidine. The H2-633-AN ligand binding to histamine H2 receptors decreased in the presence of increasing levels of ranitidine. The “scripts” within Acapella™ were used to identify the cell membrane and cytoplasm, and the degree of fluorescence in these areas was determined (Figure 3).
Figure 3. The histamine H2-selective antagonist, Ranitidine, decreased the binding of H2-633-AN to the histamine H2-receptor in a dose-dependent manner. Acapella™ was used to detect fluorescence in the membrane-bound and cytoplasmic regions. |
|
APPLICATION
PRODUCT

|
|
Confidence with Validated Stable Cell Lines
The availability of validated stable recombinant GPCR cell lines is crucial for monitoring and analyzing receptor-ligand interaction in live cells. PerkinElmer offers a comprehensive collection of GPCR-expressing cell lines, including over 280 validated stable cell lines and 64 frozen cells. Products include ValiScreen, AequoScreen®, and PhotoScreen™ GPCR cell lines, as well as AequoZen and cAMPZen ready-to-use frozen cells. All these cell lines are fully characterized in binding and functional assays, including cAMP, IP, electrophysiology or membrane potential for ValiScreen cell lines and aequorin luminescence for AequoScreen cell lines.
Conclusion
We demonstrate the synergy between PerkinElmer’s Opera high content screening and validated stably transfected GPCR cell lines with CellAura’s high affinity fluorescent ligands as a novel approach for monitoring and analyzing receptor-ligand interaction in live cells, highlighting its future application in drug discovery. Ligand binding can also be followed in real time for detailed analysis of dynamic cellular processing in a homogeneous assay set-up without the need to wash away excess ligand. Confocal imaging allows the high content assay to be robust and accurate (data not shown; see High Content Screening Scientific Posters for details). Confocal imaging also opens the avenue to binding on more complex, non-homogenous biological samples like primary cells to extract more information than with counter-based binding assays.
Download the poster
Click here to download a poster detailing this information.
References
Eglen RM, Bosse R, Reisine T (2007): Emerging concepts of guanine nucleotide-binding-coupled receptor (GPCR) function and implication for high throughput screening. Assay and Drug Development Technologies, Jun, 5(3), 425–451.
High Content Screening Scientific Posters: http://las.perkinelmer.com/imaging/scientific_imaging_posters.html
Netterwald J et al. (2009) Born to be Druggable Drug Discovery & Development magazine, Feb, 12(2), 18–21
Authors
Alison Carter 1, Katharina May2, Judith Lucke2, Hartwig Preckel 2 Vincent Dupriez3 and Eleni Mumtsidu2,
1 CellAura Technologies Ltd, Nottigham, NG1 1GF
2 PerkinElmer Cellular Technologies Germany GmbH, Cellular Imaging and Analysis, Hamburg, DE
3 PerkinElmer Inc, Belgium.
Visit www.perkinelmer.com/gpcrcomplete to learn more about total solutions for your GPCR research and discovery.
©2009 PerkinElmer, Inc. All rights reserved.
AequoScreen, AequoZen, ValiScreen, Opera, and cAMPZen are registered marks of PerkinElmer, Inc. MicroBeta2 and Acapella are a registered trademarks of PerkinElmer, Inc. All other trademarks not owned by PerkinElmer, Inc. or its subsidiaries are the property of their respective owners.
|
| |
| |
|
|
|
|